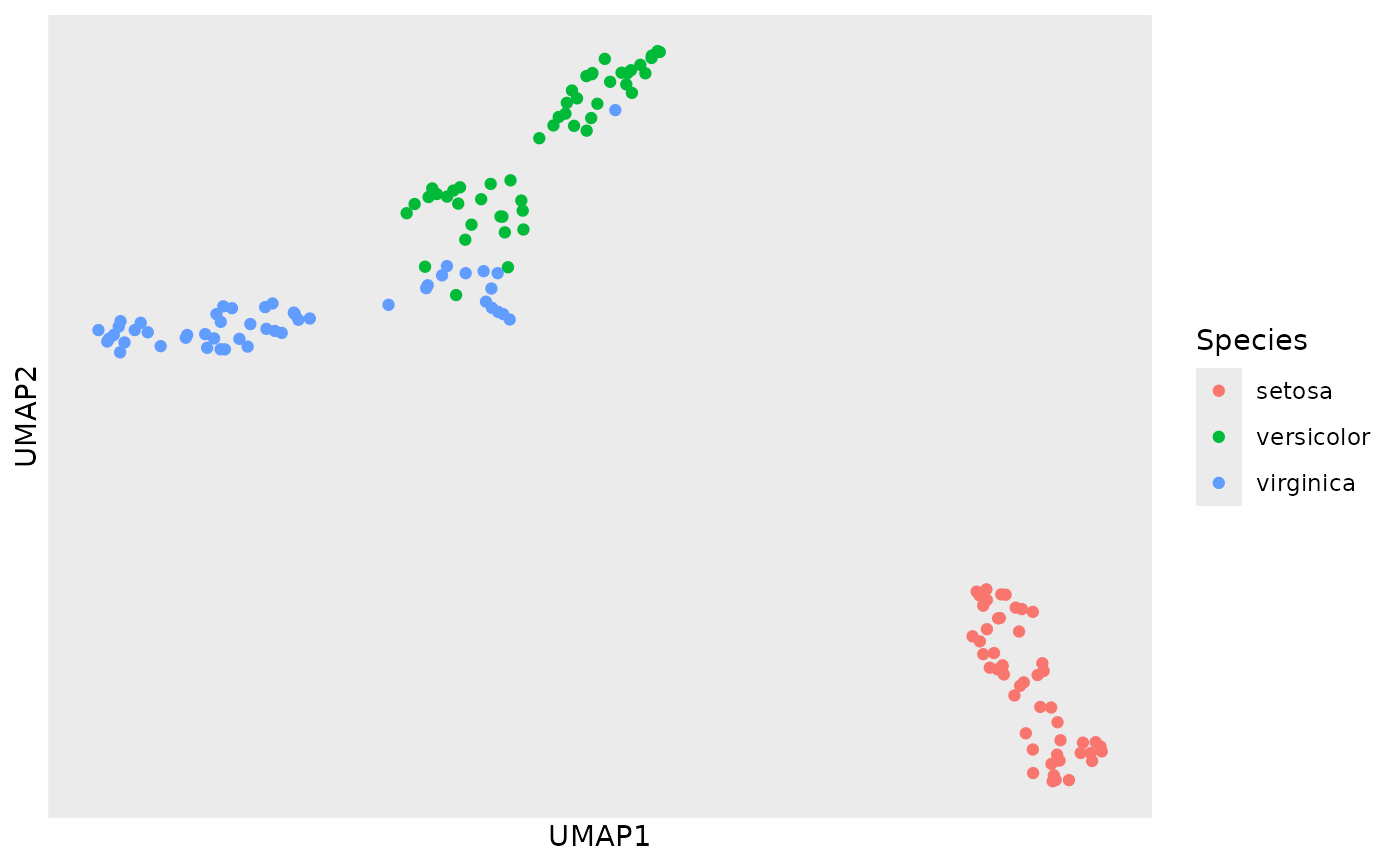
UMAP coordinates have no units and their values carry no meaning, so axis
text, ticks and grid lines are mostly noise. theme_umap() removes them.
Add it to a plot like any other theme modification, after a complete theme
such as ggplot2::theme_minimal() if you use one.
Arguments
- ...
Further theme elements passed on to
ggplot2::theme().
Value
A ggplot2::theme() object.