stat_umap() embeds the rows of the layer data in two dimensions with
Uniform Manifold Approximation and Projection (UMAP) and positions them at
the embedded coordinates. geom_umap() is a shortcut for
stat_umap(geom = "point"). Any other geom can render the embedding, e.g.
stat_umap(geom = "text") or stat_umap(geom = "density_2d").
Usage
stat_umap(
  mapping = NULL,
  data = NULL,
  geom = "point",
  position = "identity",
  ...,
  features = where(is.numeric),
  n_neighbors = 15L,
  min_dist = 0.1,
  spread = 1,
  metric = "euclidean",
  n_epochs = NULL,
  init = "auto",
  flavour = c("0.5", "0.6"),
  scale = FALSE,
  scope = c("layer", "panel"),
  seed = NA,
  n_threads = umap_threads(),
  control = umap_control(),
  na.rm = FALSE,
  show.legend = NA,
  inherit.aes = TRUE
)

geom_umap(
  mapping = NULL,
  data = NULL,
  position = "identity",
  ...,
  features = where(is.numeric),
  n_neighbors = 15L,
  min_dist = 0.1,
  spread = 1,
  metric = "euclidean",
  n_epochs = NULL,
  init = "auto",
  flavour = c("0.5", "0.6"),
  scale = FALSE,
  scope = c("layer", "panel"),
  seed = NA,
  n_threads = umap_threads(),
  control = umap_control(),
  na.rm = FALSE,
  show.legend = NA,
  inherit.aes = TRUE
)
Arguments
- mapping
Set of aesthetic mappings created by
aes(). If specified andinherit.aes = TRUE(the default), it is combined with the default mapping at the top level of the plot. You must supplymappingif there is no plot mapping.- data
The data to be displayed in this layer. There are three options:
If
NULL, the default, the data is inherited from the plot data as specified in the call toggplot().A
data.frame, or other object, will override the plot data. All objects will be fortified to produce a data frame. Seefortify()for which variables will be created.A
functionwill be called with a single argument, the plot data. The return value must be adata.frame, and will be used as the layer data. Afunctioncan be created from aformula(e.g.~ head(.x, 10)).- geom
The geometric object to display the embedding, as a string (e.g.
"point","text","density_2d") or aGeomobject.- position
A position adjustment to use on the data for this layer. This can be used in various ways, including to prevent overplotting and improving the display. The
positionargument accepts the following:The result of calling a position function, such as
position_jitter(). This method allows for passing extra arguments to the position.A string naming the position adjustment. To give the position as a string, strip the function name of the
position_prefix. For example, to useposition_jitter(), give the position as"jitter".For more information and other ways to specify the position, see the layer position documentation.
- ...
Other arguments passed on to
ggplot2::layer(), such as aesthetics likecolour = "red"orsize = 3, or geom parameters.- features
<
tidy-select> Columns of the layer data to use as UMAP input. Defaults to all numeric columns. Columns used by mapped aesthetics are only included if they are selected too.- n_neighbors
Size of the local neighbourhood (number of nearest neighbours). Larger values preserve more global structure.
- min_dist
Minimum distance between embedded points. Smaller values give tighter clusters.
- spread
Scale of the embedded points; together with
min_distit determines how clumped the embedding is.- metric
Distance metric in the input space, for example
"euclidean"(default),"cosine","manhattan"or"correlation".- n_epochs
Number of optimisation epochs.
NULLuses the default (500 for small, 200 for large data sets).- init
Initialisation of the embedding:
"auto"(spectral forflavour = "0.5", recursive for"0.6"),"spectral","tswspectral","pca","random"or"recursive".- flavour
Which umap-learn pipeline to reproduce.
"0.5"(default) is the established algorithm: spectral initialisation and stochastic gradient descent."0.6"uses recursive initialisation and the Adam optimiser, and is deterministic for a fixed number of threads.- scale
Standardise each feature to zero mean and unit variance before embedding? Recommended when features have different units.
- scope
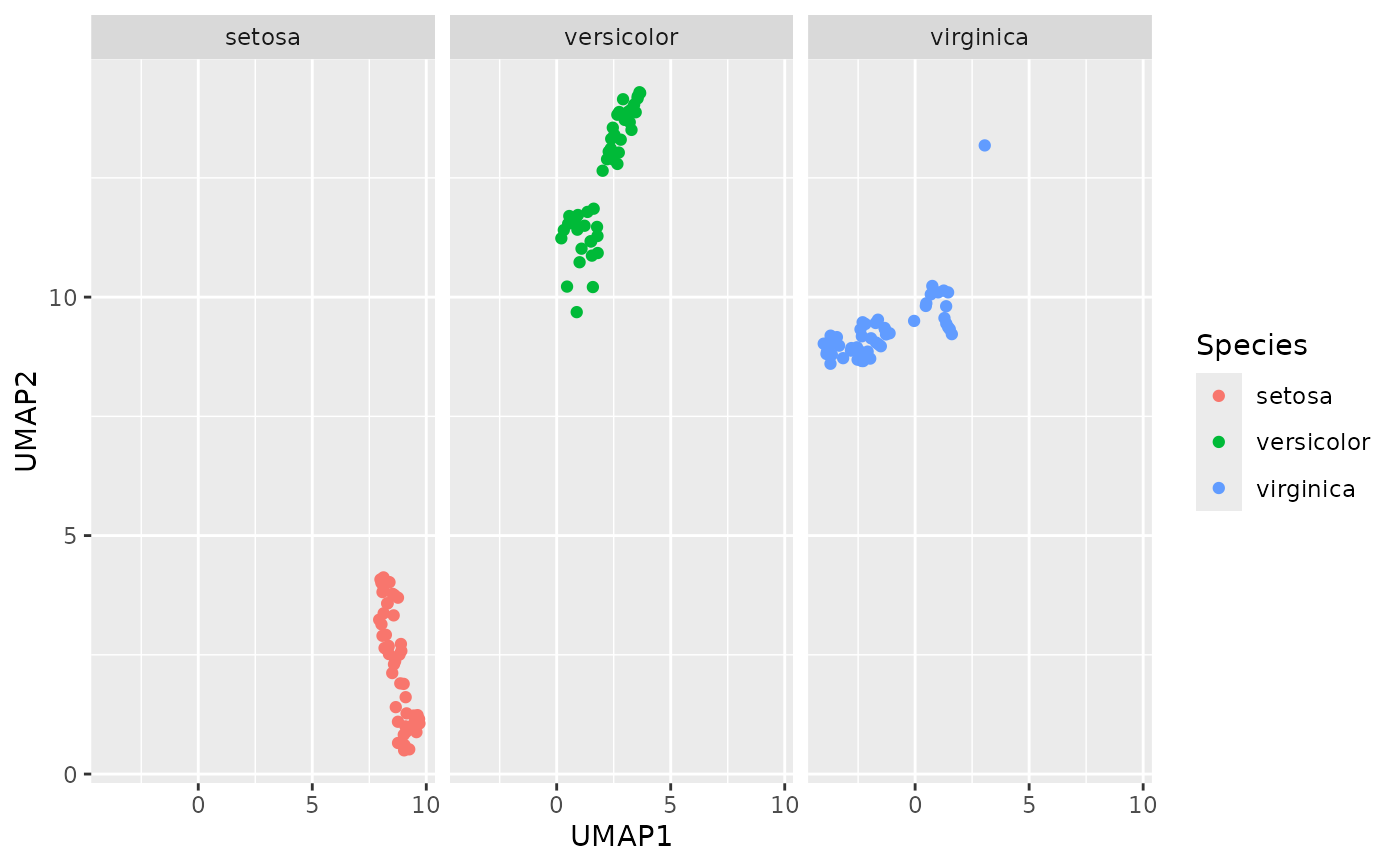
"layer"(default) computes one embedding for the whole layer; facets then show subsets of the same embedding."panel"computes a separate embedding for every facet panel.- seed
Random seed:
NA(default) derives it from the data, an integer fixes it, andNULLdraws a new one every time the plot is built.- n_threads
Number of threads. Defaults to
umap_threads().- control
Advanced parameters created by
umap_control().- na.rm
If
FALSE(default), rows with missing feature values are removed with a warning. IfTRUE, they are removed silently.- show.legend
logical. Should this layer be included in the legends?
NA, the default, includes if any aesthetics are mapped.FALSEnever includes, andTRUEalways includes. It can also be a named logical vector to finely select the aesthetics to display. To include legend keys for all levels, even when no data exists, useTRUE. IfNA, all levels are shown in legend, but unobserved levels are omitted.- inherit.aes
If
FALSE, overrides the default aesthetics, rather than combining with them. This is most useful for helper functions that define both data and aesthetics and shouldn't inherit behaviour from the default plot specification, e.g.annotation_borders().
Details
Feature columns are selected with features, using the same syntax as
dplyr::select(), from the layer data. Aesthetics such as colour,
shape or label are carried along row by row; they never split the
computation into separate embeddings.
Computed variables
after_stat(UMAP1),after_stat(UMAP2)Embedding coordinates, mapped to
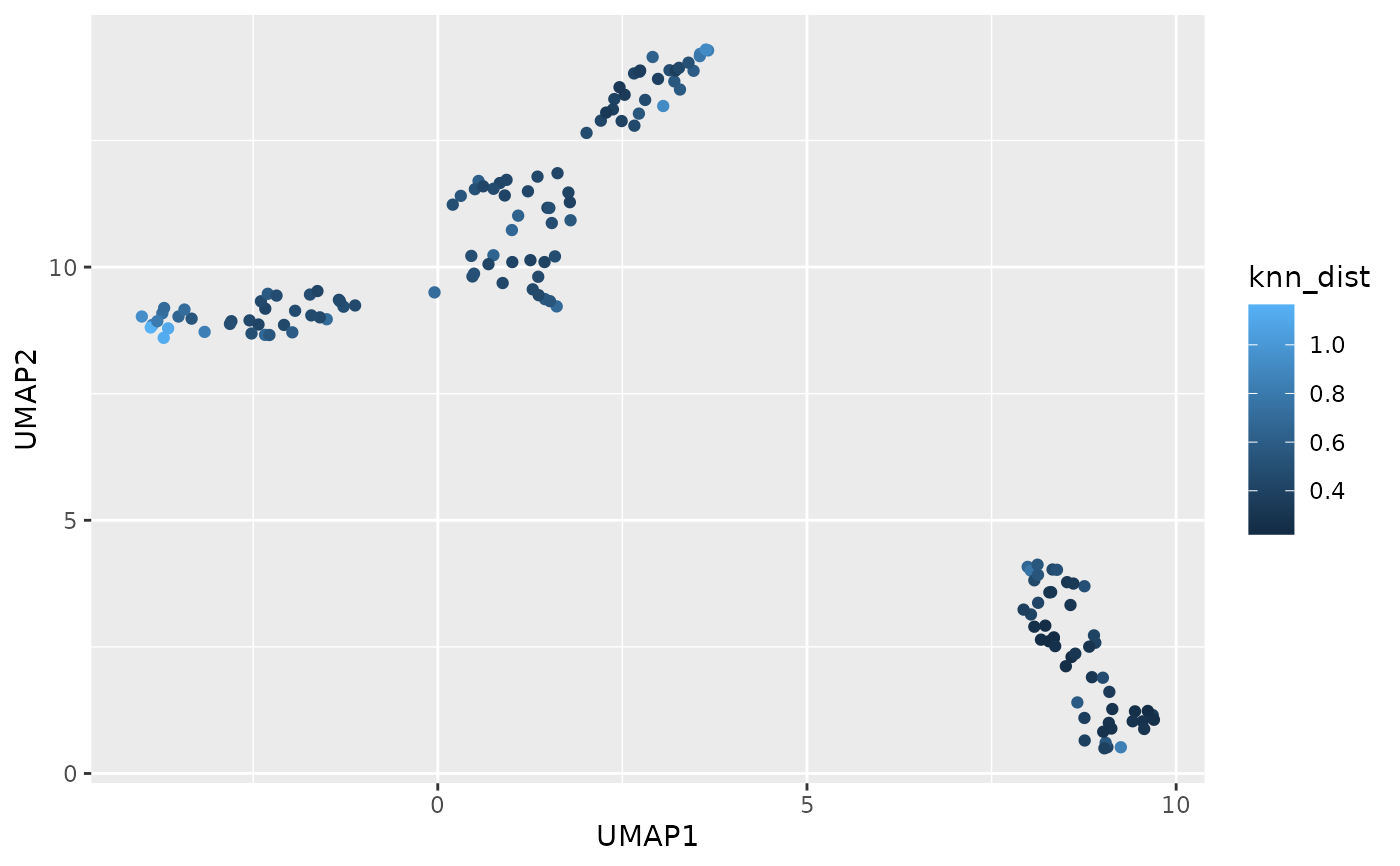
xandyby default.after_stat(knn_dist)Mean distance of each observation to its nearest neighbours in input space; large values indicate outliers.
after_stat(row)Row number of the observation in the layer data.
Reproducibility and caching
By default (seed = NA) the random seed is derived from the data and the
parameters. A plot therefore looks the same every time it is drawn, and
several layers of the same data share one embedding. Use an integer seed
to choose another layout, or NULL for a new random layout on every draw.
Results are cached in memory (see umap_cache_clear()), so printing,
resizing or saving a plot does not recompute the embedding.
With flavour = "0.5" and more than one thread, the optimisation is
parallel and not bit-for-bit reproducible across sessions; use
n_threads = 1 or flavour = "0.6" if you need exact reproducibility.
Examples
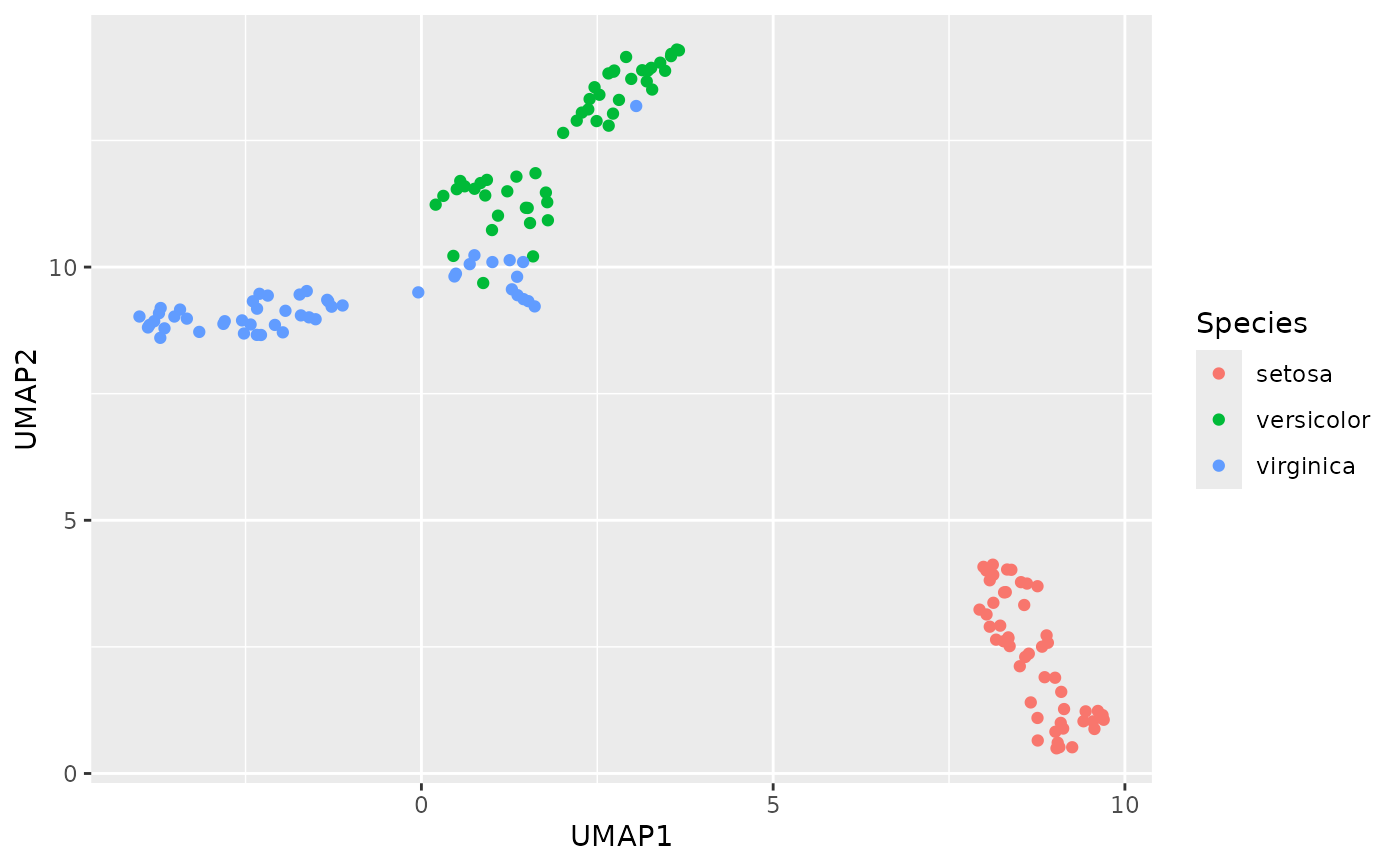
library(ggplot2)
# All numeric columns are features by default
ggplot(iris, aes(colour = Species)) +
geom_umap()
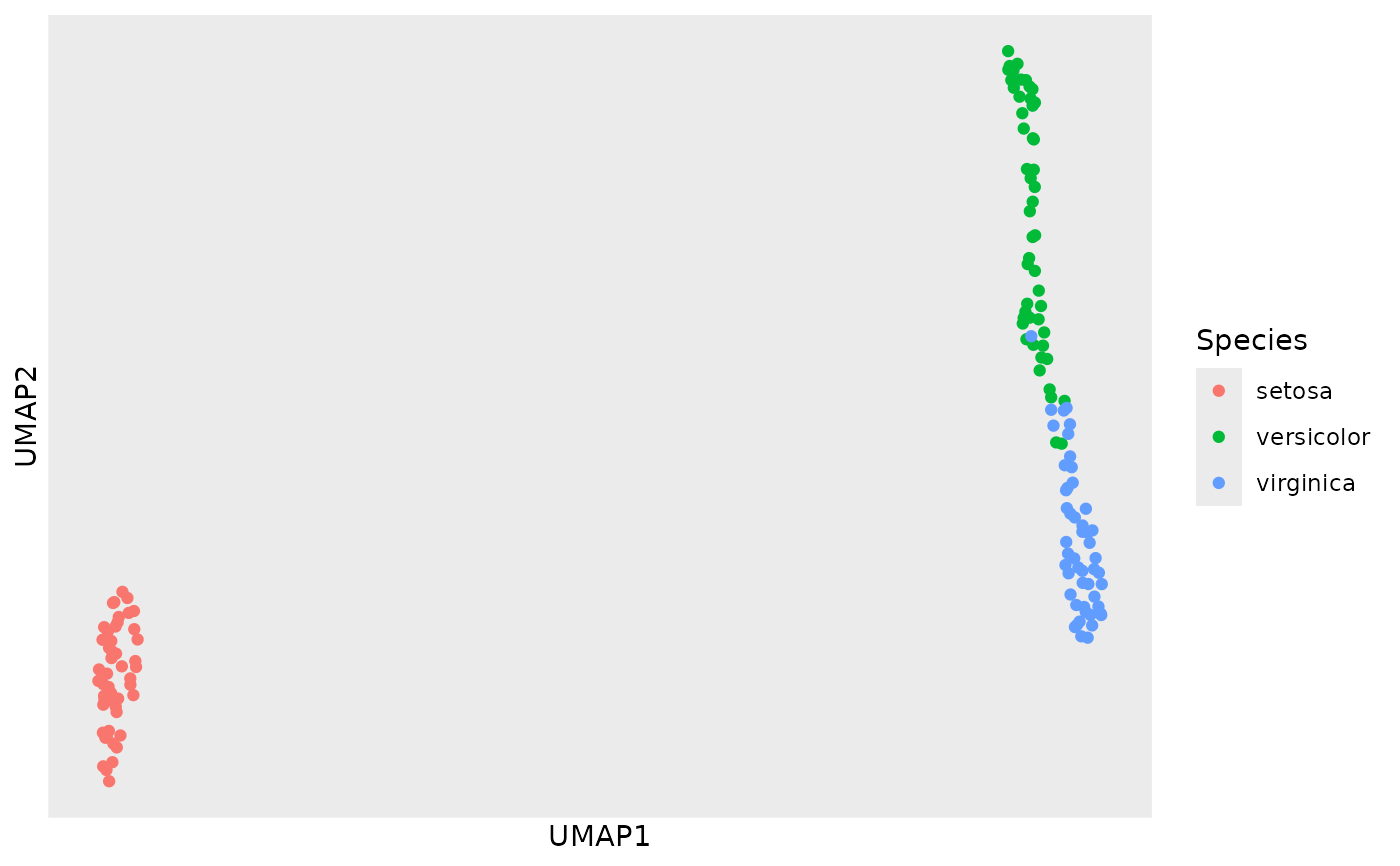
 # Select features explicitly, tune UMAP and remove the meaningless axes
ggplot(iris, aes(colour = Species)) +
geom_umap(features = starts_with("Petal"), n_neighbors = 30, min_dist = 0.5) +
theme_umap()
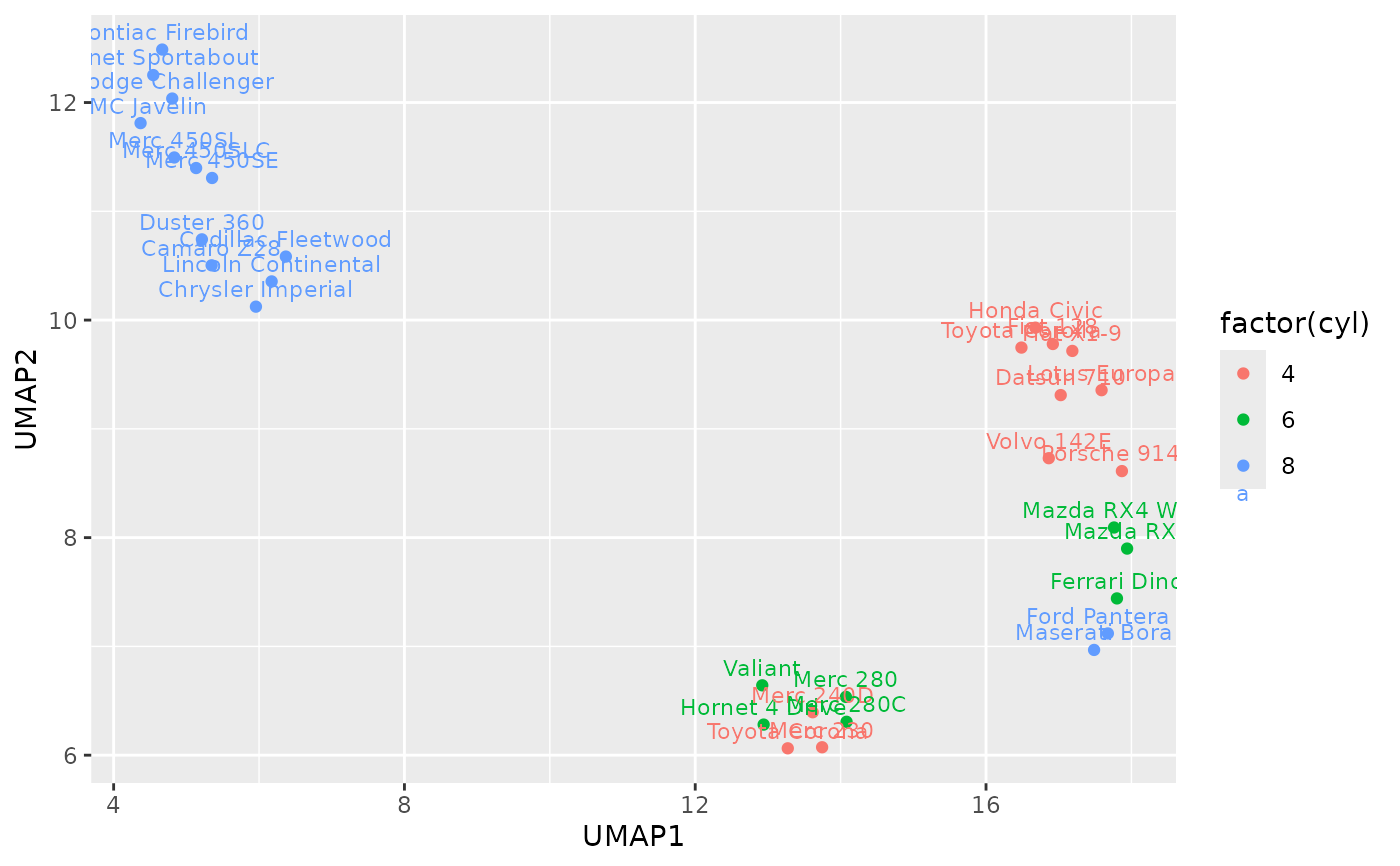
 # Several layers share one embedding
ggplot(mtcars, aes(label = rownames(mtcars), colour = factor(cyl))) +
geom_umap(scale = TRUE, n_neighbors = 5) +
stat_umap(geom = "text", scale = TRUE, n_neighbors = 5, vjust = -0.6, size = 3)
 # Colour by computed variables
ggplot(iris) +
geom_umap(aes(colour = after_stat(knn_dist)))
 # One embedding, faceted
ggplot(iris, aes(colour = Species)) +
geom_umap() +
facet_wrap(vars(Species))
 # \donttest{
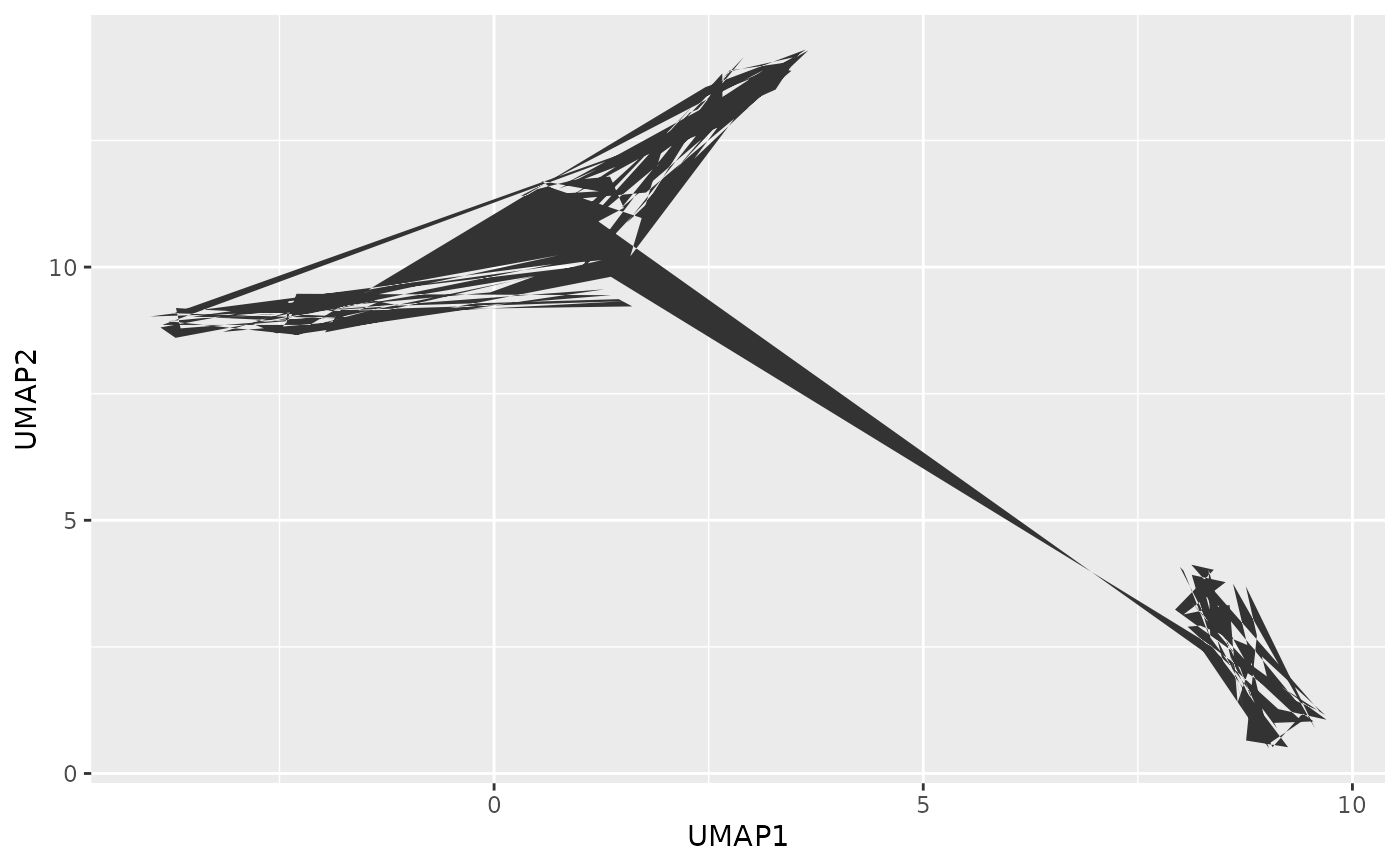
# Density of the embedding
ggplot(iris) +
stat_umap(geom = "density_2d_filled", contour_var = "ndensity")
#> Warning: Ignoring unknown parameters: `contour_var`
 # }